
Figure 6.
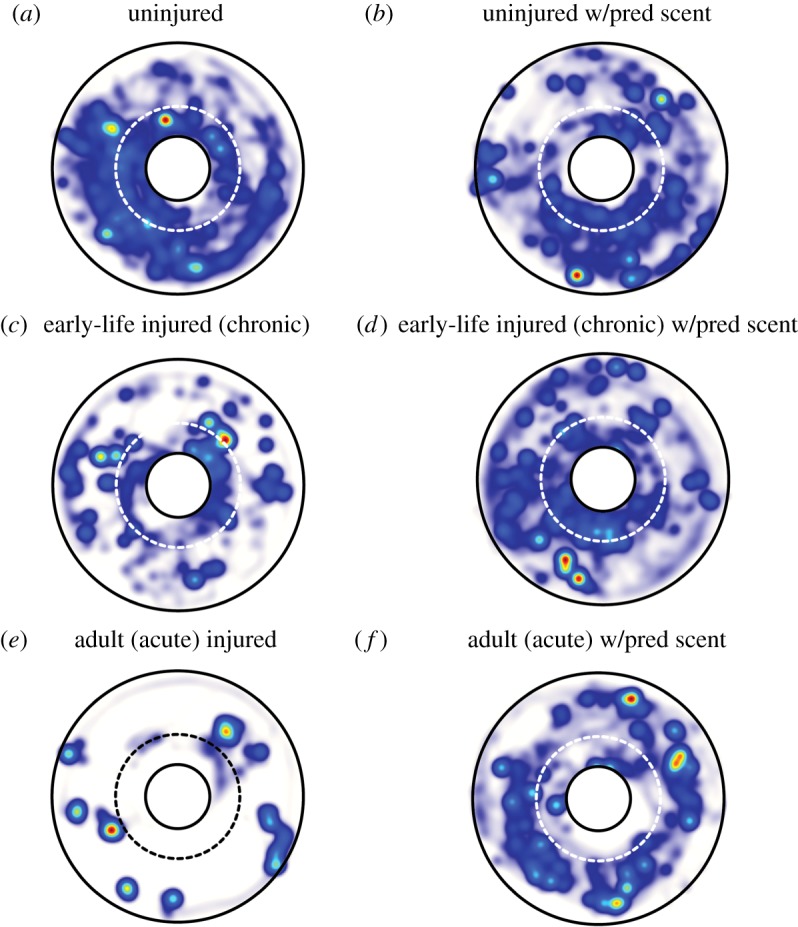
Heatmaps generated by automated video tracking of squid activity during the 10 min trial of the aversive conditioning experiment (Ethovision, Noldus). Colour shows the relative dwell time in a given area (blue, low; red, high), averaged over all animals in a treatment group. Outer arena boundaries are in black. The beaker containing shrimp prey is centred in the arena and shown as a white circle outlined in black. Broken lines (white or black) show the ‘strike zone’ around the beaker. (a,b) In general, uninjured animals were highly active, with limited periods of stasis. No clear difference in space use is apparent in the presence of predator scent. (c,d) Early-life injured squid showed somewhat less activity and reduced use of space, but increased activity and space use in the presence of predator scent. (e,f) Acutely injured (late-life injured) squid showed limited activity in the absence of predator scent, but increased activity when a predator cue was present. (Online version in colour.)