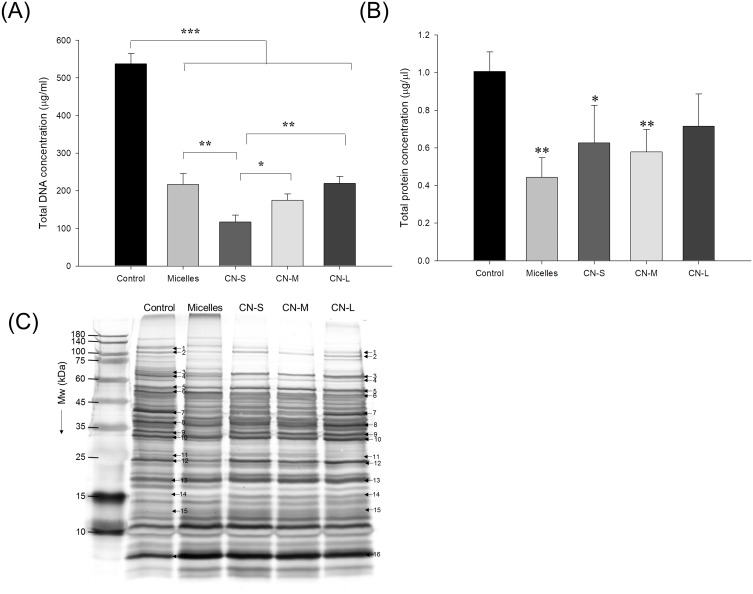
Figure 5.
The genomic and proteomic profiles of MRSA treated by micelles and squalene@CPC nanoemulsions: (A) analysis of the quality of MRSA genomic DNA by agarose gel electrophoresis; (B) total protein concentration in MRSA; and (C) the protein change of MRSA analyzed by SDS-PAGE and MALDI-TOF/TOF mass. All data are presented as the mean of three experiments±S.D. ***p < 0.001; **p < 0.01; *p < 0.05.

