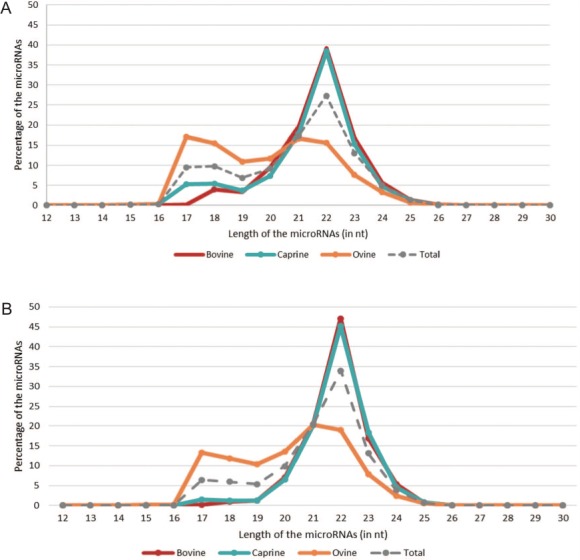
Figure 4.

microRNA length distributions across species. The red, blue and orange lines correspond to the percentages of bovine, caprine and ovine microRNAs, respectively, based on their length [in nucleotides (nt)]. The gray dotted line represents all the microRNAs listed in RumimiR. (A) Percentage of all sequences collected in RumimiR. (B) Percentage of sequences with a low false-positive score (code containing 0 and 1 `1’).
