Figure 4.

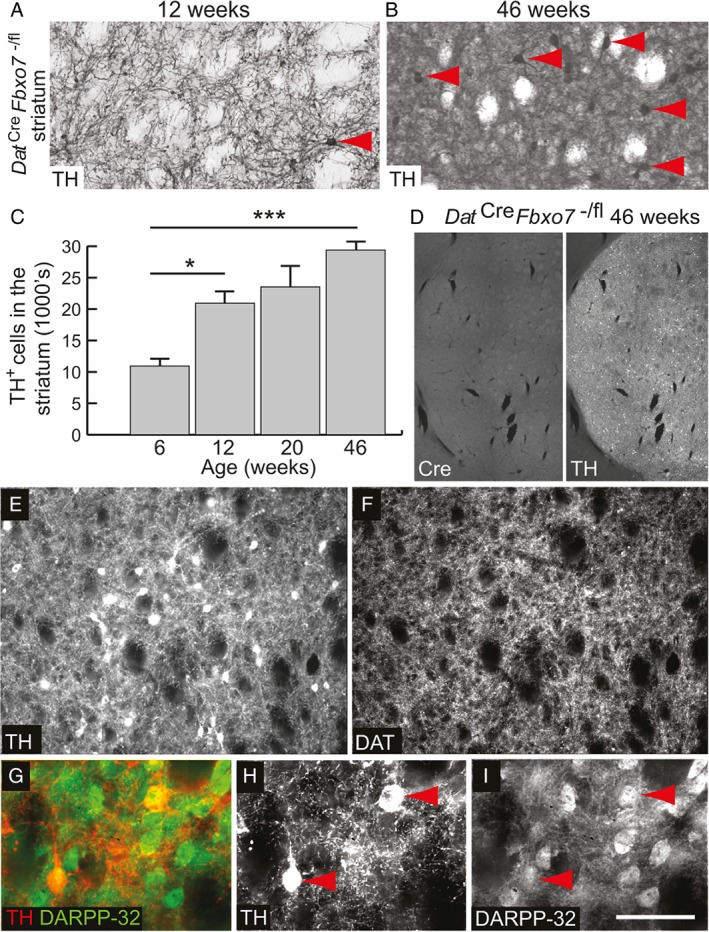
Ectopic expression of TH in the striatum of mutant mice. (A, B) Magnified image of TH‐immunostained striatum from Dat Cre Fbxo7 −/fl mice at (A) 12 weeks and (B) 46 weeks, showing TH+ cell bodies (red arrowheads). (C) Quantification of TH+ cell bodies in the striatum. ANOVA *p < 0.05; ***p < 0.001. (D) Immunofluorescence staining for Cre and TH in the striatum from Dat Cre Fbxo7 −/fl mice, demonstrating no ectopic Cre expression. (E, F) Immunofluorescence staining for TH (E) and DAT (F) in the striatum of 46‐week‐old Dat Cre Fbxo7 −/fl mice. TH+ cell bodies in the striatum are negative for DAT expression. (G–I) Immunofluorescence staining for (H) TH and (I) DARPP‐32 with (G) merged image in the striatum of 46‐week‐old Dat Cre Fbxo7 −/fl mice. TH+ cell bodies in the striatum are positive for DARPP‐32 expression (red arrowheads), suggesting medium spiny neuron origin. The scale bar in I represents 300 μm for A, B, E, F; 1 mm for D; and 100 μm for G–I.
