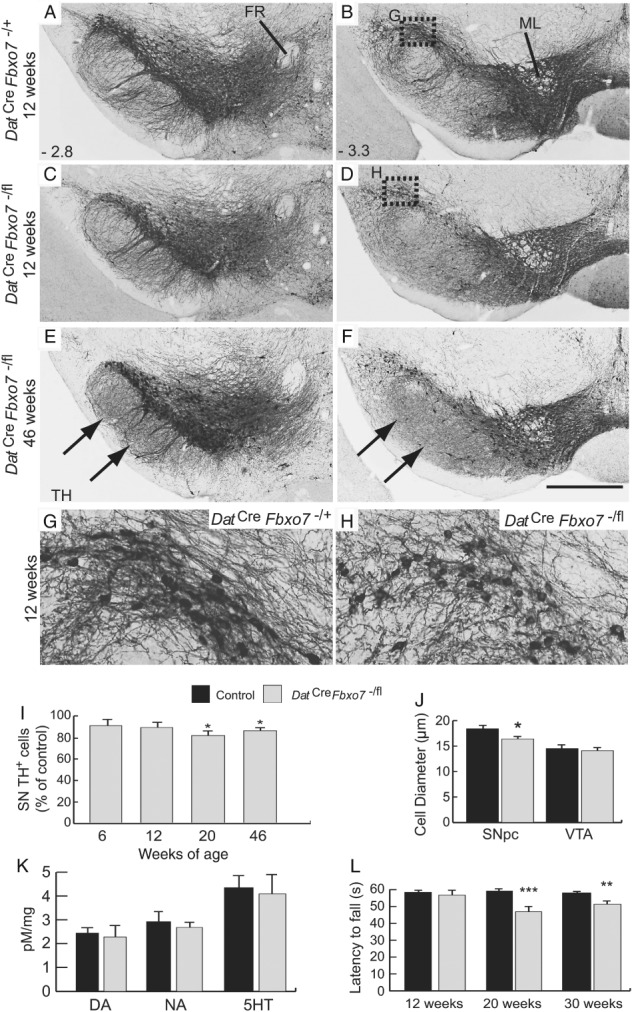
Figure 5.

Smaller cell size and decreased cell number in the substantia nigra of mutant mice. (A–F) TH immunostaining of the VTA and substantia nigra from (A, B) control and (C–F) mutant mice at 12 (A–D) and 46 weeks (E, F) at −2.8 mm (A, C, E) and −3.3 mm (B, D, F) relative to the bregma. Arrows in E and F highlight regions of increased TH+ expression in the very fine fibres of the striatonigral pathway in the SNpr (originating from TH+ cells in the striatum). (G, H) Magnification of the SNpc regions highlighted in B and D, of control (G) and mutant (H) mice, showing smaller TH+ cell bodies and fewer neurites in mutant mice. (I) Stereological estimations of TH+ cell bodies in the SNpc of Dat Cre Fbxo7 −/+ and Dat Cre Fbxo7 fl/+ mice (control), and experimental Dat Cre Fbxo7 −/fl mice at 6, 12, 20, and 46 weeks. (J) Quantification of the diameter of TH+ cell bodies in the SNpc and VTA of control and Dat Cre Fbxo7 −/fl mice at 12 weeks. (K) Quantification of neurotransmitter levels in the ventral midbrain of 5‐week‐old Dat Cre Fbxo7 −/+ and Dat Cre Fbxo7 fl/+ mice (control) and Dat Cre Fbxo7 −/fl mice using HPLC analysis. (L) Rotarod behavioural analysis of control and Dat Cre Fbxo7 −/fl mice at 12, 20, and 30 weeks of age, showing latency to fall. **p < 0.05; ***p < 0.005. FR, fasciculus retroflexus; ML, medial lemniscus; DA, dopamine; NA, noradrenaline; 5HT, serotonin. The scale bar in F represents 300 μm for A–F and 80 μm in G, H.
