Figure 3.

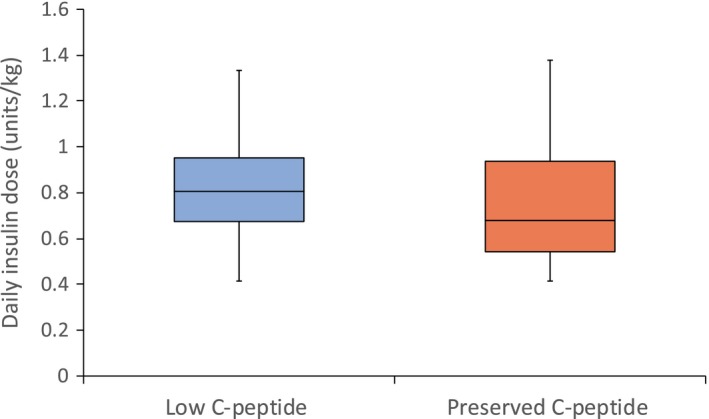
Boxplot of daily insulin dose by C‐peptide group. Insulin dose was lower in the preserved C‐peptide group (n = 70) vs. the low (n = 151) group, P = 0.01. Outliers are shown in Fig. S5.

Boxplot of daily insulin dose by C‐peptide group. Insulin dose was lower in the preserved C‐peptide group (n = 70) vs. the low (n = 151) group, P = 0.01. Outliers are shown in Fig. S5.