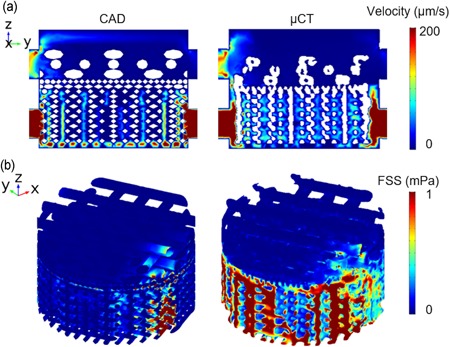
Figure 7.

(a) Flow velocity distribution on the cross‐sectional slice for CAD and µCT model. (b) Fluid induced shear stress on the scaffold for the CAD and µCT model. CAD, computer aided design; μCT, microcomputed tomography [Color figure can be viewed at wileyonlinelibrary.com]
