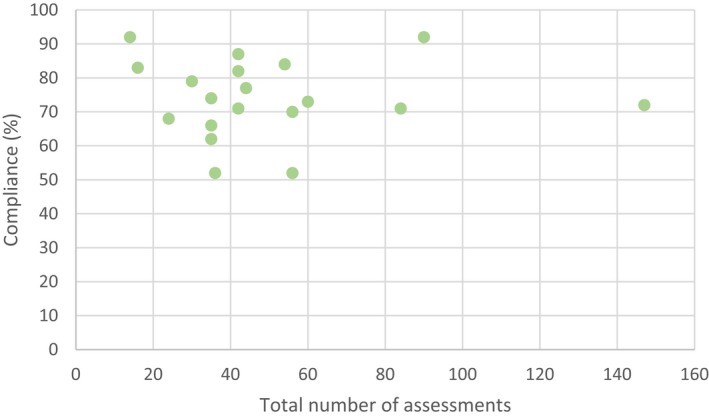
Figure 2.

Relation between total number of assessments and compliance rate (N = 19). Note. Out of the total of N = 23 unique data sets, N = 4 did not report compliance rates. Those studies could not be included in the Figure. [Color figure can be viewed at http://wileyonlinelibrary.com]
