
Figure 1.
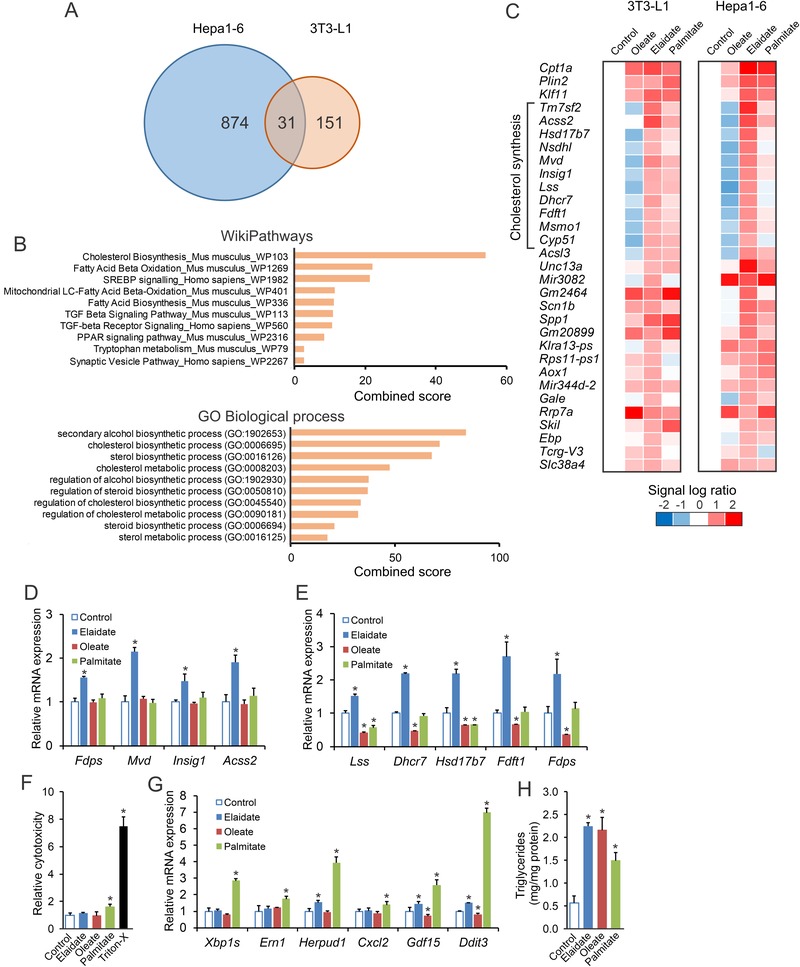
Elaidate induces a cholesterogenic expression profile in differentiated 3T3‐L1 and Hepa1‐6 cells. Differentiated 3T3‐L1 cells were treated with 1 mm fatty acids for 24 h. Hepa1‐6 cells were treated with 500 µm fatty acids for 24 h. A) Venn diagram based on transcriptomics analysis showing the number of genes upregulated by elaidate by at least 1.5‐fold. B) Pathway analysis by Enrichr of the 31 genes commonly upregulated by elaidate in differentiated 3T3‐L1 and Hepa1‐6 cells. C) Heatmap showing relative expression profile of the 31 genes in differentiated 3T3‐L1 and Hepa1‐6 cells after treatment with elaidate, oleate, or palmitate. mRNA expression of cholesterol synthesis genes in D) 3T3‐L1 adipocytes and E) Hepa1‐6 cells. F) Relative cytotoxicity in Hepa1‐6 cells as determined by lactate dehydrogenase assay. G) mRNA expression of ER stress marker genes in Hepa1‐6 cells. mRNA expression was normalized to 36b4. H) Triglyceride content in Hepa1‐6 cells. Data are mean ± SD; *p < 0.05 relative to control.