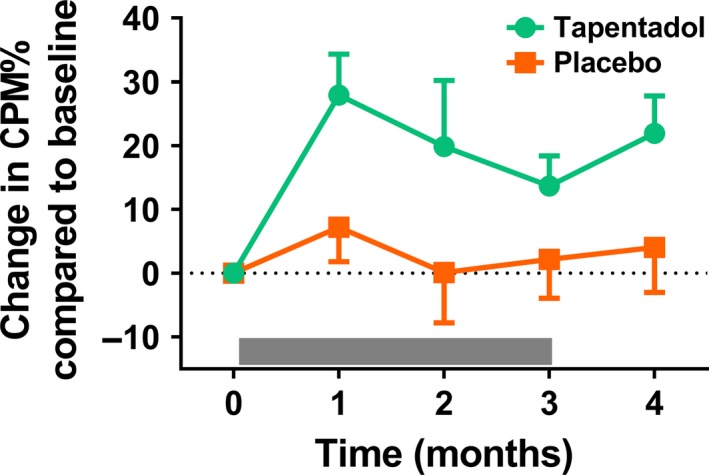
Figure 2.

Change in CPM response relative to baseline before, during and after treatment with tapentadol (green circles) or placebo (orange squares). A significant treatment effect on CPM was observed for tapentadol compared to placebo (p = 0.042). The grey bar indicates the treatment period. Data are mean ± SEM. CPM, conditioned pain modulation
