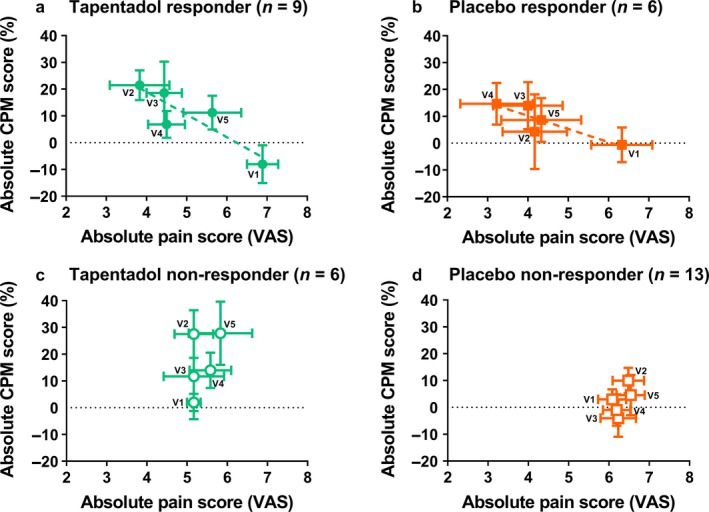
Figure 4.

CPM% versus spontaneous pain ratings for the different visits in the (a) tapentadol responder group (closed green circles), the (b) placebo responder group (closed orange squares), the (c) tapentadol non‐responder group (open green circles) and the (d) placebo non‐responder group (open orange squares). A significant correlation was only observed for the tapentadol responder group (r 2 = 0.78; p = 0.047; green dotted line). Data are mean ± SEM. CPM, conditioned pain modulation; VAS, visual analogue scale; V1, visit 1; V2, visit 2; V3, visit 3; V4, visit 4; V5, visit 5
