
Figure 2.
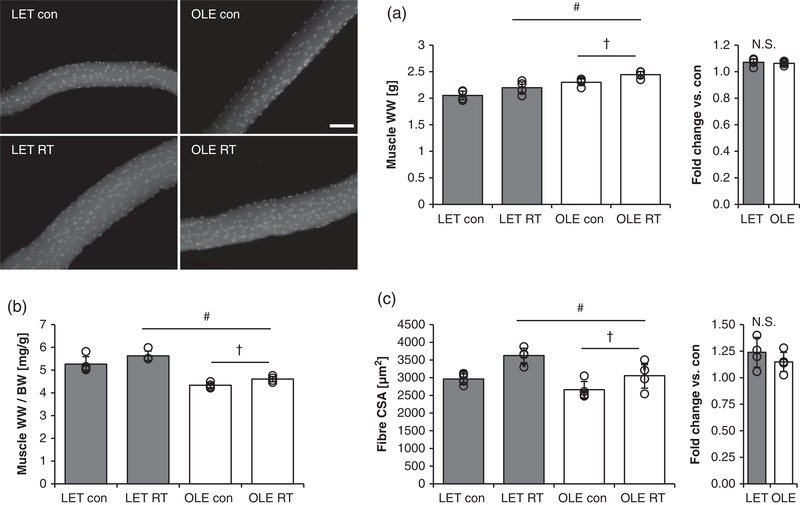
Effect of T2DM and resistance training on skeletal muscle size. Effect of RT on skeletal muscle mass (a,b; LET n = 5, OLE n = 7), fibre CSA (c; average value from 80 fibres in each condition, n = 4 per group) in control and T2DM rats. BW, body weight; RT, resistance training; WW, wet weight. #Main effect of training (P < 0.05). †Main effect of T2DM (P < 0.05). Values are means ± SD