
Figure 5.
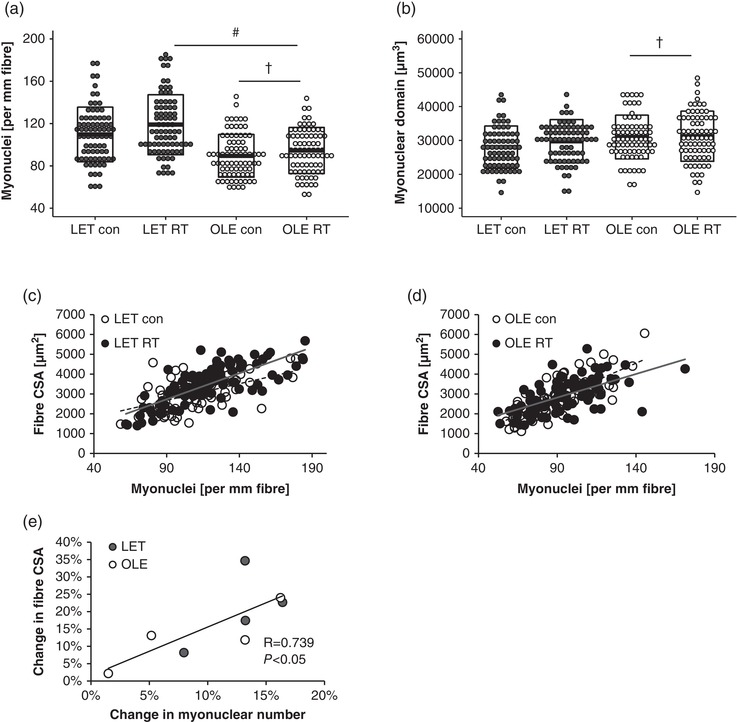
Effect of T2DM and resistance training on myonuclear number and myonuclear domain size. (a) Myonuclear number per unit fibre. (b) Myonuclear domain size. #Main effect of training (P < 0.05). †Main effect of T2DM (P < 0.05). Box indicates means ± SD. (c,d) Relationship between myonuclear number and fibre cross‐sectional area (CSA) in control rat (c) and T2DM rat (d). (e) Relationship between change in myonuclear numbers vs. change in fibre CSA