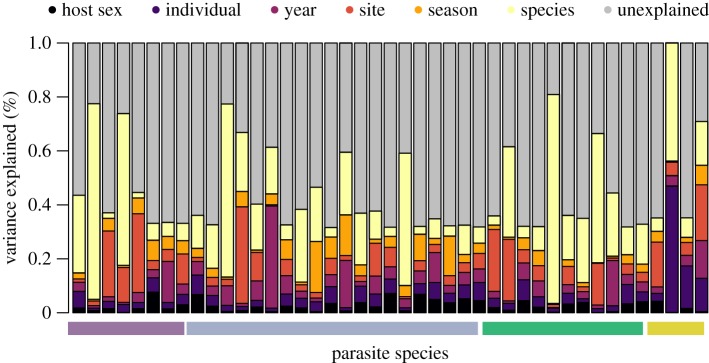
Figure 2.
The variance explained by each random effect for each parasite species (columns), suggesting that host species explains the most variation in the distribution of parasite communities among host individuals. The coloured bar at the bottom identifies parasite species by the dominant host tissue they are found to infect (caecum in purple; ectoparasites in blue; small intestine in green; stomach in yellow). Bar height was standardized such that the highest Tjur’s R2 value of the trained model contained no unexplained variation, in order to show the relative importance of fixed and random effects to model performance. (Online version in colour.)

