
Figure 3.
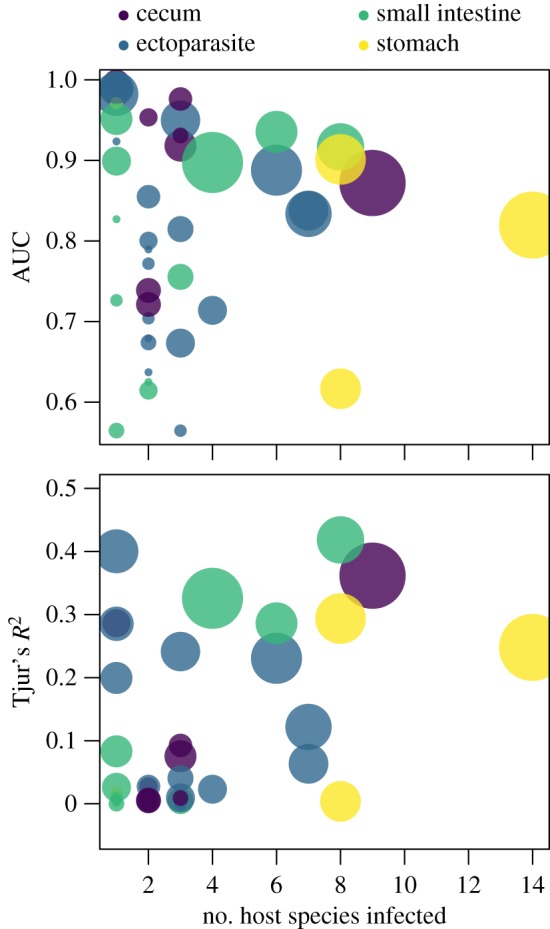
AUC and Tjur’s R2 as a function of the number of host species infected. These values are based on predictions from the fivefold cross-validated model. Each point represents a parasite species, and point size is proportional to the log number of individuals that each parasite species infects. Model performance appears to degrade when occurrence data is limited (smaller point size) and when the number of host species infected is small (host specificity increases). (Online version in colour.)