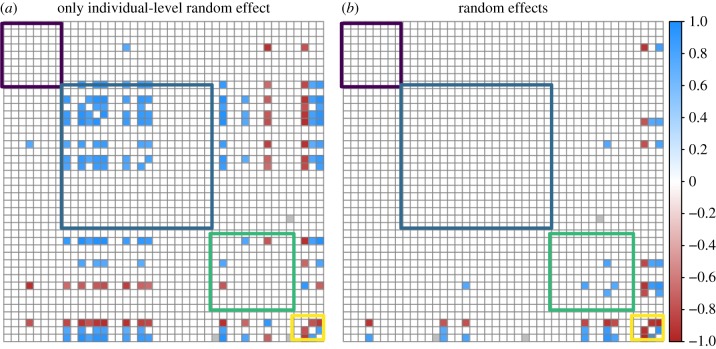
Figure 4.
Estimated parasite–parasite associations (90% support threshold) for (a) a model not incorporating random effects compared with (b) a model incorporating random effects. Parasite species are ordered based on the host tissue they predominantly infect, with coloured boxes indicating parasite–parasite associations when the same host tissue is infected (caecum in purple; ectoparasites in blue; small intestine in green; stomach in yellow). Pervasive positive associations detected in the model which does not consider geographical and host trait covariates suggests the importance of conditioning parasite associations on relevant covariates, suggesting simple correlational approaches are inappropriate for detecting parasite associations. (Online version in colour.)

