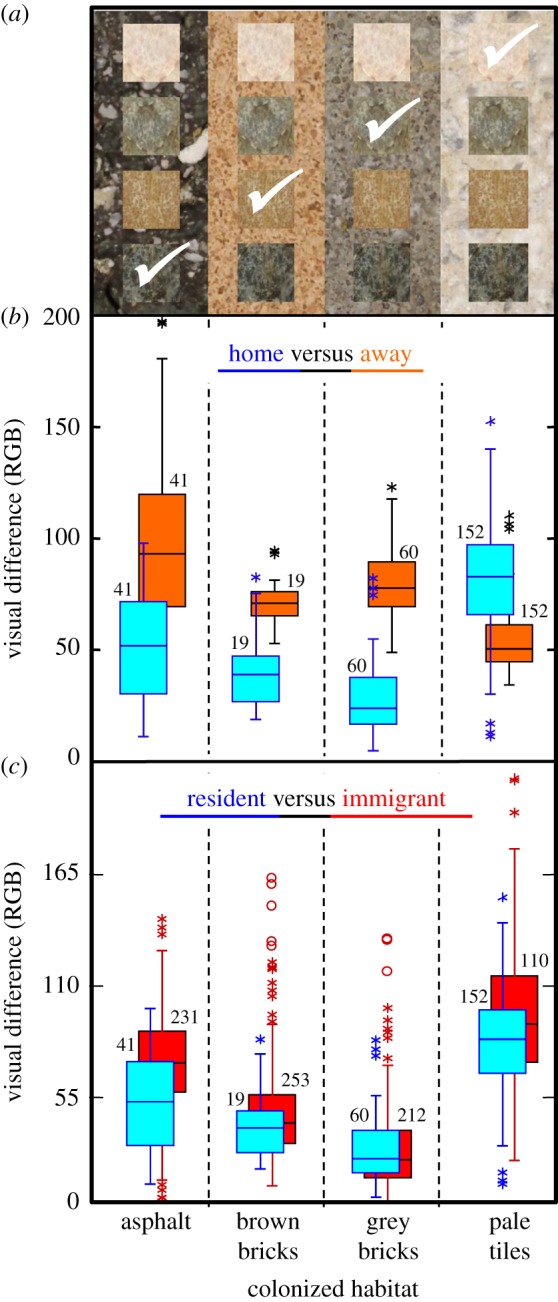
Figure 3.

Grasshoppers are more cryptic than expected by chance as they colonize novel, urban habitats. (a) Background images are representative of each of the four street habitats, with representative parts of four grasshopper individuals positioned on top (small square images of the thorax). For each individual (same individual per row), the white tick-mark indicates in which habitat it is presumably (this depends on the predator's visual system) most cryptic (i.e. lowest visual distance). (b) Comparing crypsis in own versus other habitats. Pale blue boxes: observed visual differences between colour of the grasshoppers and colour of their local habitats (home). Dark orange boxes: predicted visual differences if those same individuals were using the other three habitats in proportion to their availability (away). Visual differences are expressed as RGB differences (a quantification of colour differences, see Methods). (c) Comparing crypsis between resident versus potential immigrant grasshoppers. Pale blue boxes: observed visual differences (local residents). Dark red boxes: predicted visual differences if all the grasshoppers from the other three habitats would use the focal habitat (potential immigrants). Sample sizes are given for each box plot; ntotal = 272. All comparisons of (b,c) are significant at p < 0.001, except home versus away for pale tiles (p = 1.00) and resident versus immigrant for brown bricks (p = 0.096) and grey bricks (p = 0.377). Tukey-type box plots: middle line = median; box = central 50% of values = interquartile range; whiskers = highest and lowest value within 1.5 × interquartile range; stars = values within 3 × interquartile range; circles = values outside 3 × interquartile range. (Online version in colour.)
