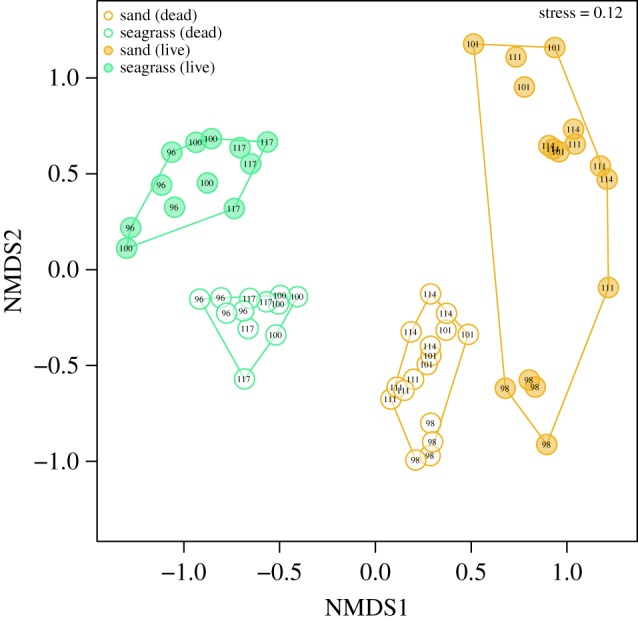
Figure 2.

NMDS of 28 samples representing seven sites; three seagrass and four open sand sites, respectively. The ordination (k = 3 dimensions) was derived using the Bray–Curtis dissimilarities applied to relative abundance counts. Filled symbols represent LA and open symbols represent DA. Site numbers, i.e. unique spatial identifiers, are indicated for each sample.
