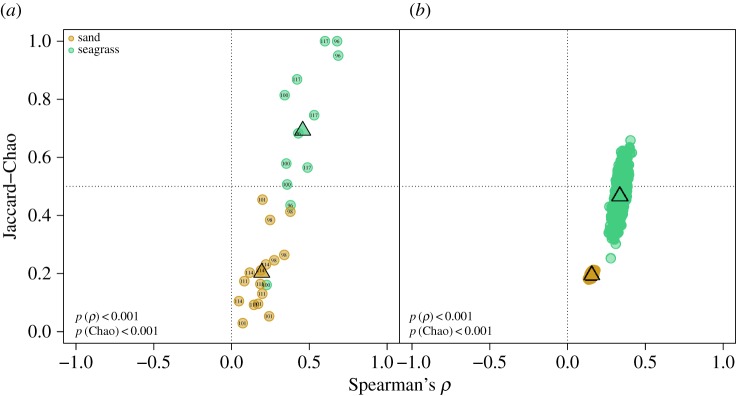
Figure 6.
Comparison of LA and DA using (a) raw-score sample values and (b) random sample-standardized abundances to control for small-sample bias (10 000 iterations). Indices are (i) Spearman's non-parametric rank-order correlation of species abundances (Spearman's ρ), and (ii) live–dead community similarity using the Jaccard–Chao's similarity index with an adjustment to control for the effects of unseen species [50]. Samples occurring in the top-right quadrat have the highest fidelity, while samples occurring lower have reduced fidelity. Triangles represent the respective group centroids. Respective p-values are superimposed in the lower left corner.

