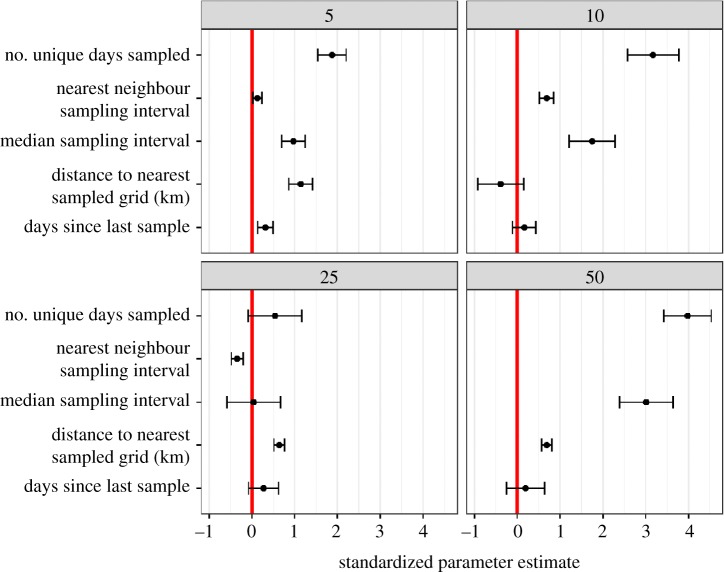
Figure 2.
The parameter estimates (and 95% confidence intervals) for four separate linear models (i.e. at each of the respective grain sizes), showing the relative strength of the results and effect sizes for each of the predictors. Full summary statistics for each of the predictors can be found in appendix 4 in the electronic supplementary material. Variables were log-transformed and then standardized, allowing for direct comparison among effect sizes. (Online version in colour.)

