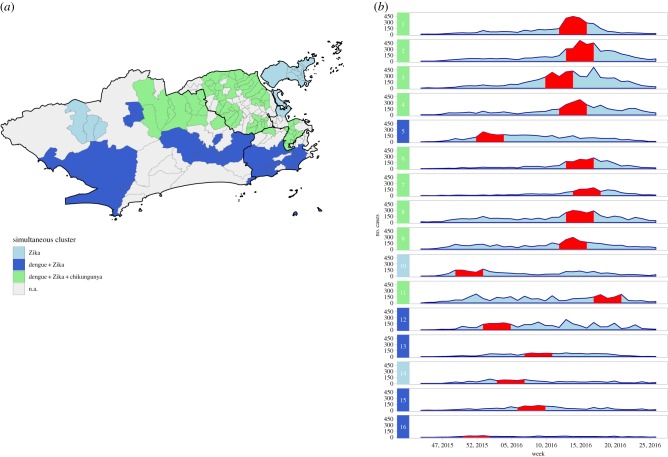
Figure 6.
(a) Clusters of dengue, chikungunya and Zika detected using the multivariate scan statistic and (b) temporal distribution of cases by cluster, between epidemiological weeks 31, 2015 and 52, 2016, Rio de Janeiro city, Brazil. Red bands represent the time period in which the cluster was detected. Clusters are ordered according to the maximum LLR, with 1 being the most likely cluster.

