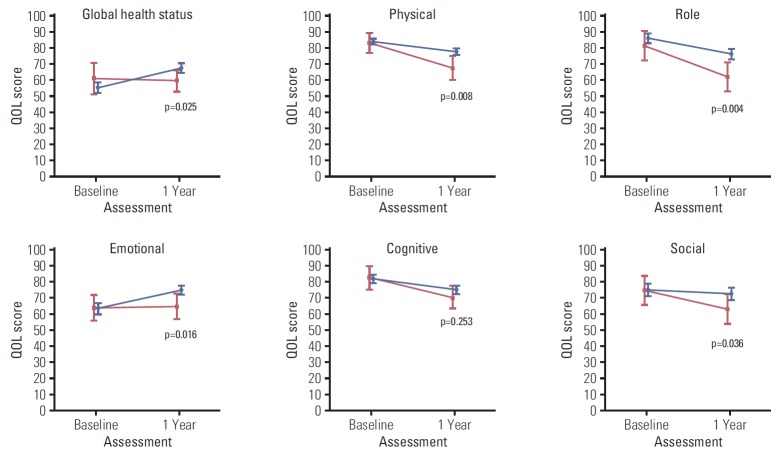
Fig. 2.
Health-related quality of life (QOL) measured by QLQ-C30 functional scale after diagnosis (baseline) and at 1-year post-diagnosis (1 year). Blue color indicates the QOL mean scores and 95% confidence intervals for survivors. Red color indicates QOL mean scores and 95% confidence intervals for deaths. p-values were obtained using the Kruskal-Wallis test to compare QOL scores measured at 1-year post-diagnosis between survivors and deaths.

