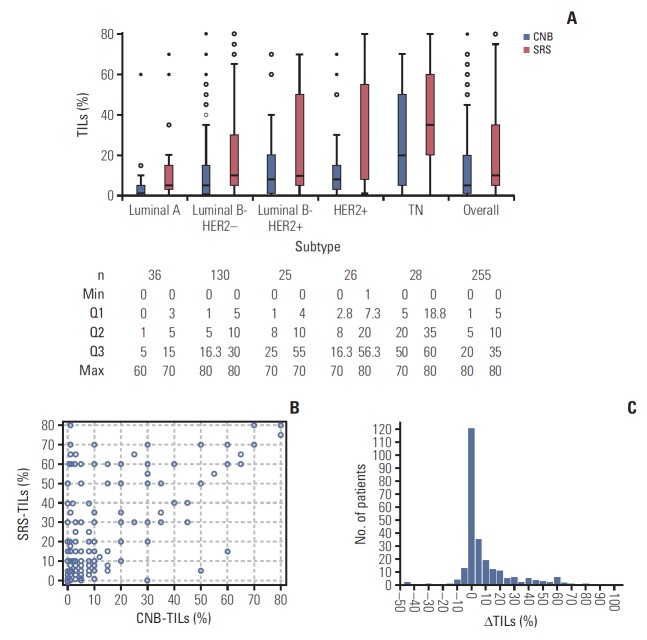
Fig. 1.
Distribution of TILs and ΔTILs. (A) Distribution of CNB-TILs% and SRS-TILs% in the global population and per breast cancer subtype. The box shows the limits of the middle half of the data (1st to 3rd quartile), and the line inside represents the median. Whiskers are drawn to represent values within 1.5 times the length of the box from either end of the box (1.5 times the interquartile range). Open circles correspond to mild outliers. Asterisks correspond to extreme outliers. (B) Distribution of CNB-TILs and SRS-TILs per patient. Each open circle represents one patient; (C) Distribution of ΔTILs (per 10%). TILs, tumor infiltrating lymphocytes; ΔTILs, change of TILs; CNB, core needle biopsy; SRS, surgery removed sample, Max, maximum; Min, minimum; Q, quartile.

