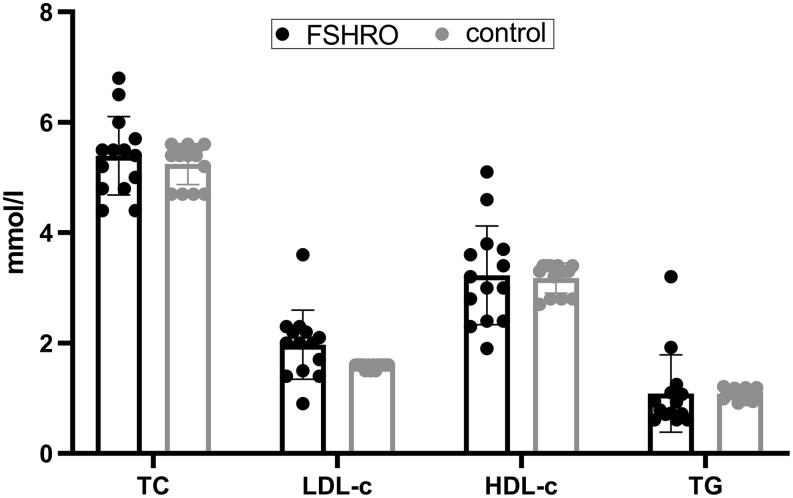
Figure 2.
Lipid profile of the FSHRO and control groups. Data points for the control group represent the mean of all age-matched controls for each FSHRO subject from the FINRISK Study. Box indicates mean, bars indicate ±s.d. HDL-c, high-density lipoprotein cholesterol; LDL-c, low-density lipoprotein cholesterol; TC, total cholesterol; TG, triglycerides.

 This work is licensed under a