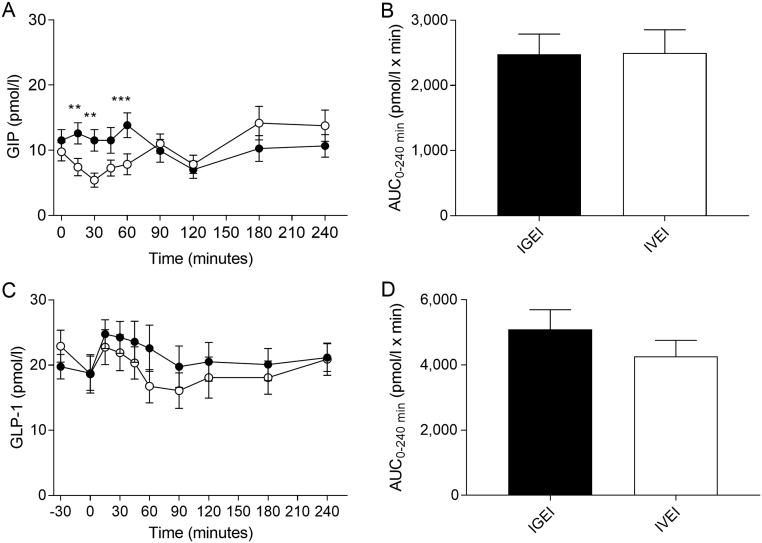
Figure 5.
Plasma glucose-dependent insulinotropic polypeptide (GIP) concentrations (A) and corresponding area under the curve (AUC) values (B), and plasma glucagon-like peptide 1 (GLP-1) concentrations (C) and corresponding AUCs (D) during intragastric alcohol infusion (IGEI) (black circles) and intravenous alcohol infusion (IVEI) (white circles). Asterisks indicate statistically significant interactions between intervention and time were evaluated by multiple comparisons. **P < 0.005; ***P < 0.0005. Data are mean ± s.e.m.

 This work is licensed under a