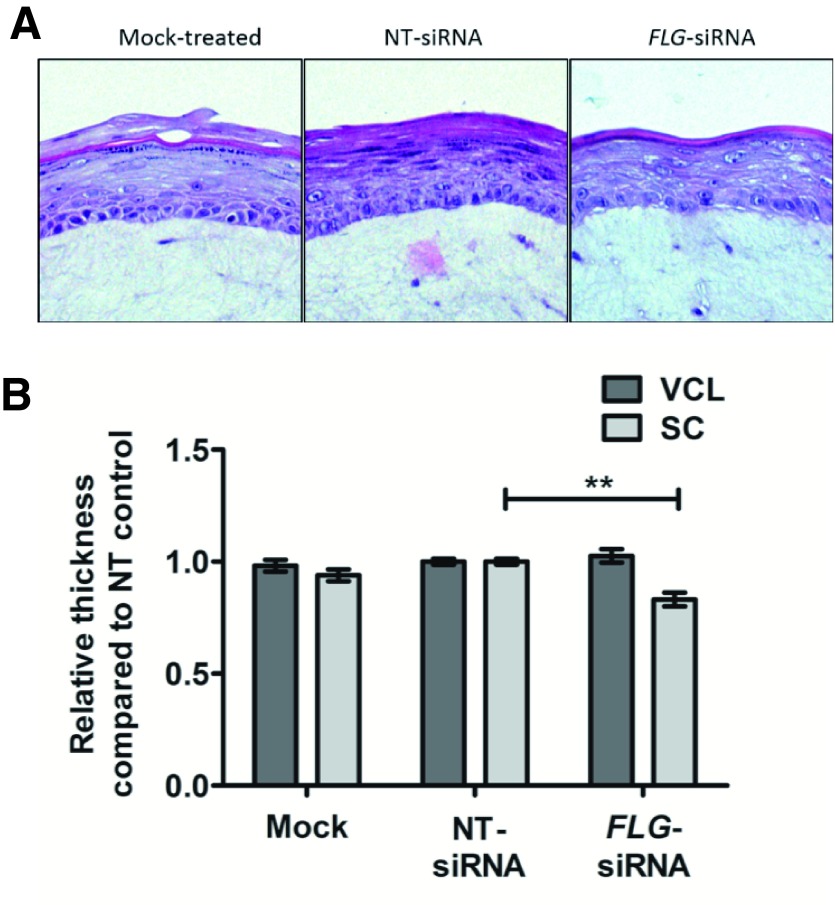
Figure 4. Structural changes in organoid models.
( A) Histological examination (representative images from 8 biological replicates). NT, non-targeting. ( B) Measurement of relative thickness of epidermal layers: VCL, viable cell layer and SC, stratum corneum; n=8; compared using paired t-test; **p<0.005.

