Figure 3.

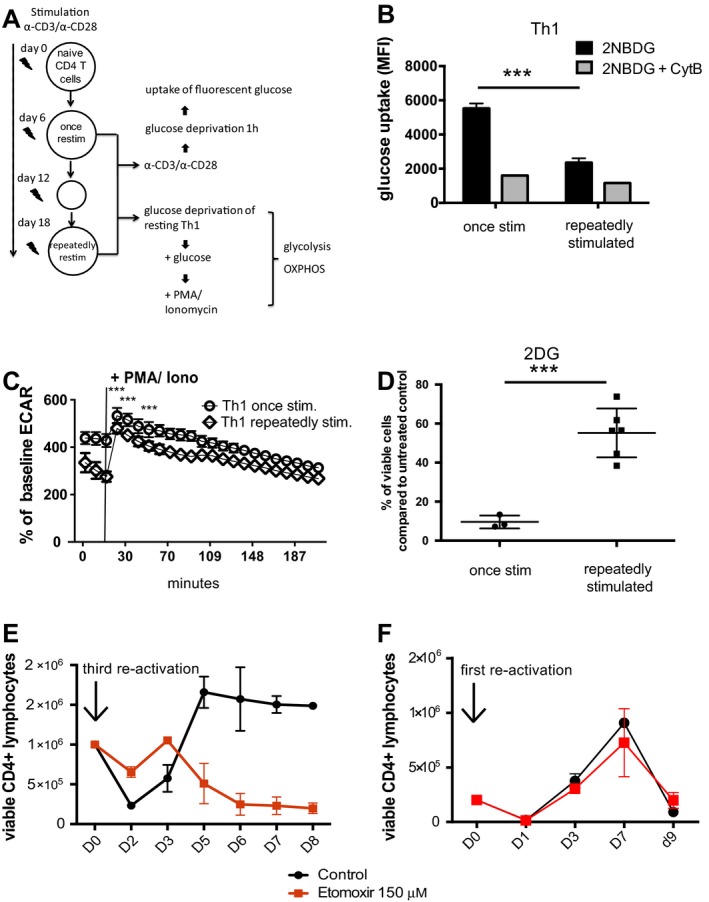
Repeatedly stimulated (stim) murine Th1 cells switch their metabolism from glycolysis to fatty acid oxidation. A, Experimental design. Naive CD4+CD62L+ T cells isolated from C57BL/6 mice were stimulated once or stimulated 2 additional times at 6‐day intervals with anti‐CD3/anti‐CD28 antibodies under Th1‐differentiating conditions. Cells were analyzed for energy metabolism. OXPHOS = oxidative phosphorylation. B, Glucose uptake in murine Th1 cells stimulated once and repeatedly stimulated murine Th1 cells, measured by flow cytometry using the fluorescent glucose analog 2‐([7‐nitro‐2,1,3‐benzoxadiazol‐4‐yl]amino)‐2 deoxyglucose (2‐NBDG). Th1 cells were restimulated for 6 hours with anti‐CD3 and anti‐CD28 antibodies prior to analysis. Cytochalasin B (CytB) was used to determine background fluorescence. Bars show the mean ± SEM. Results are representative of 3 independent experiments. *** = P < 0.0006 by Mann‐Whitney 2‐tailed test. C, Glycolytic activity, measured by extracellular acidification rate (ECAR), in murine Th1 cells stimulated once and repeatedly stimulated murine Th1 cells before and after restimulation with phorbol 12‐myristate 13‐acetate (PMA) and ionomycin (iono). Values are the mean ± SEM (n = 4 samples per group). *** = P < 0.0001 at 14 minutes, P = 0.0027 at 30 minutes, and P = 0.0027 at 50 minutes after glucose addition, by 2‐tailed t‐test. D, Frequency of viable murine CD4+ T cells stimulated once and murine CD4+ T cells stimulated repeatedly after restimulation with anti‐CD3/anti‐CD28 antibodies in the presence of the glycolysis inhibitor 2‐deoxy‐d‐glucose (2‐DG; 2 mM) for 72 hours, relative to cells cultivated without inhibitor (untreated control). Symbols represent individual samples; horizontal lines and error bars show the mean ± SEM. *** = P = 0.0005 by t‐test. E and F, Absolute number of repeatedly stimulated murine Th1 cells (E) and murine Th1 cells stimulated once (F) and restimulated with anti‐CD3/anti‐CD28 antibodies in the presence or absence of 150 μM etomoxir. Viability and cell count were determined by propidium iodide exclusion using flow cytometry. Values are the mean ± SEM. Results are representative of 3 experiments. MFI = mean fluorescence intensity.
