
Figure 6.
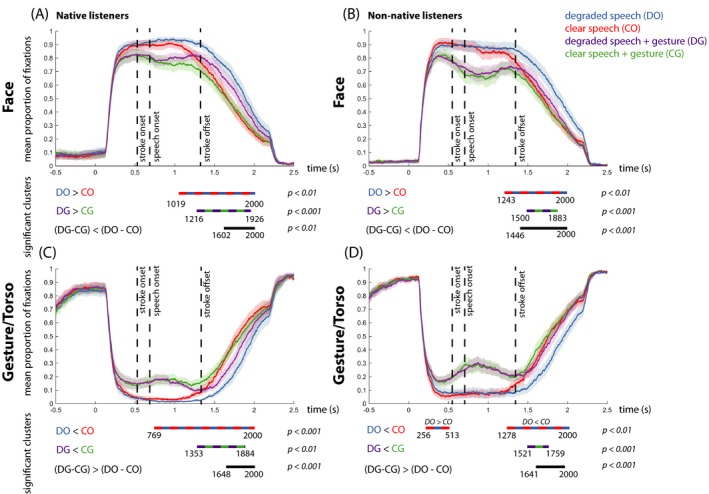
Mean proportion of fixation over time on the face for native listeners (A) and non‐native listeners (B). Mean proportion of fixations over time on the body (“Gesture/Torso”) for native (C) and non‐native listeners (D). In all graphs, each color represents a condition (DO = blue, CO = red, DG = purple, CG = green), and shaded color bars around the mean proportion lines represent standard error. Below each graph, the difference between the conditions and the direction of the effects is specified per comparison. The colored dashed lines represent the differences between the conditions in the significant time‐intervals. “n.s.” denotes “not significant.”