
Figure 1.
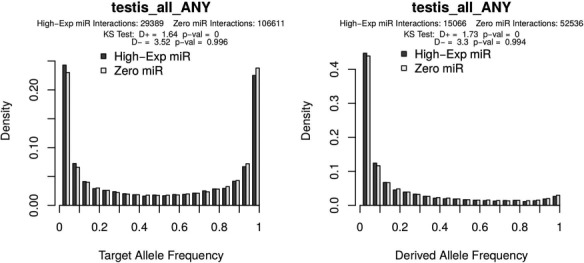
Allele frequency distributions as generated from the PopTargs web server. The left panel shows the target allele frequency distribution for microRNAs highly expressed in testes (grey bars) and for microRNAs whose expression was not detected in testes (white bars). Likewise, the right panel shows the target allele frequency distribution of derived alleles, that is, where the ancestral allele is a non-target. The latter plot is also often called the site frequency spectrum.