Figure 2.

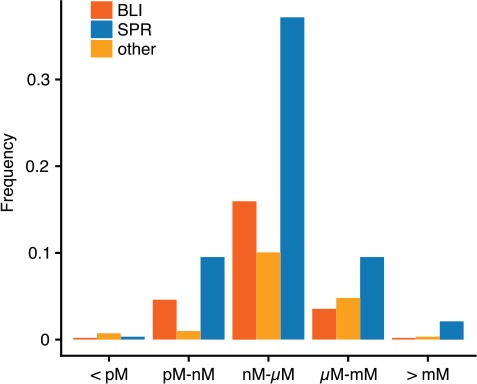
Normalized distribution of KD values by method. Shown are the frequencies of interactions with a KD in a specific range for the major methods SPR and BLI. Other methods are summarized.

Normalized distribution of KD values by method. Shown are the frequencies of interactions with a KD in a specific range for the major methods SPR and BLI. Other methods are summarized.