Fig. 3.
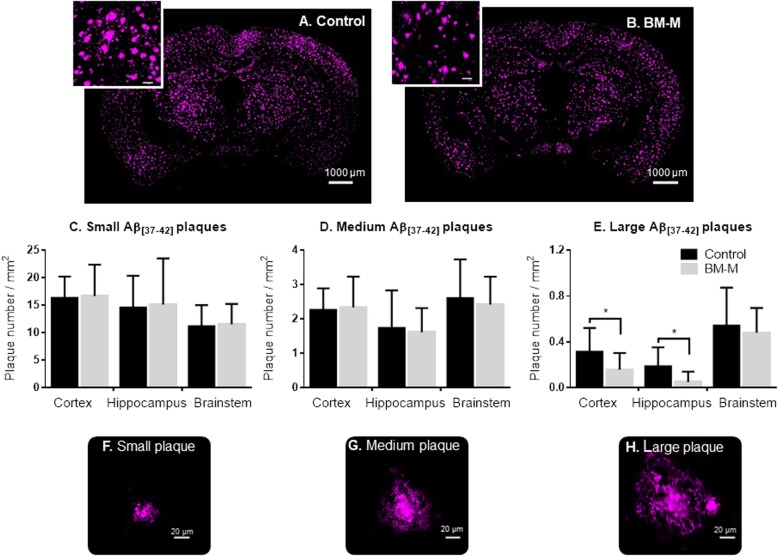
Aβ[37-42] plaques number decrease in cortex and hippocampus of APP/PS1 mice treated with BM-M. a, b Representative Aβ[37-42] plaques immunostaining comparison between PBS injected mice (control) and BM-M treated mice, showing less large plaques in transplanted animals. c-e Small, medium and large plaque number per mm2 in cortex, hippocampus and brainstem comparison between control and BM-M treated mice showing a reduction of larger plaque in cortex and hippocampus. f-h Representative images of different plaque sizes stained by immunohistochemistry are shown. Bar graphs display the mean ± SEM (error bars) of plaque (*p < 0.05)

