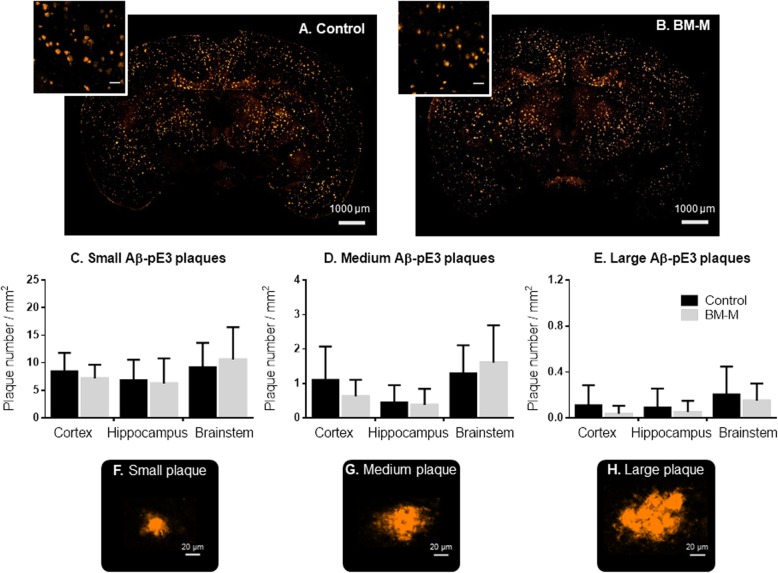
Fig. 4.
Aβ-pE3 plaques number in cortex and hippocampus of APP/PS1 mice treated with BM-M. a, b Representative Aβ-pE3 plaques immunostaining comparison between PBS injected mice (Control) and BM-M treated mice, showing no significant change in Aβ-pE3 plaque subgroup (c-e). Small, medium and large plaque number per mm2 in cortex, hippocampus and brainstem comparison between control and BM-M treated mice (f-h) Representative images of different plaque sizes stained by immunohistochemistry. Bar graphs display the mean ± SEM (error bars) of plaque

