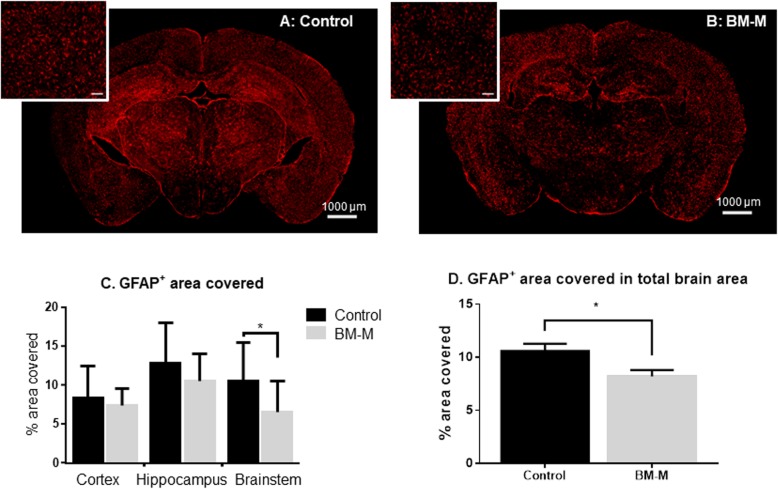
Fig. 6.
GFAP (astrocytes) area covered decreases on APP/PS1 mice treated with BM-M. a, b Representative GFAP immunostaining comparison between PBS injected mice (control) and BM-M treated mice showing less area covered by GFAP in the brains of the transplanted mice group. c Percentage of GFAP+ area covered in cortex, hippocampus and brainstem individually, shows a significant decrease in the brain stem area of BM-M treated mice. Bar graphs display the mean ± SEM (error bars) (*p < 0.05). d Percentage of GFAP+ area covered in total brain area shows a significant reduction upon BM-M transplantation

