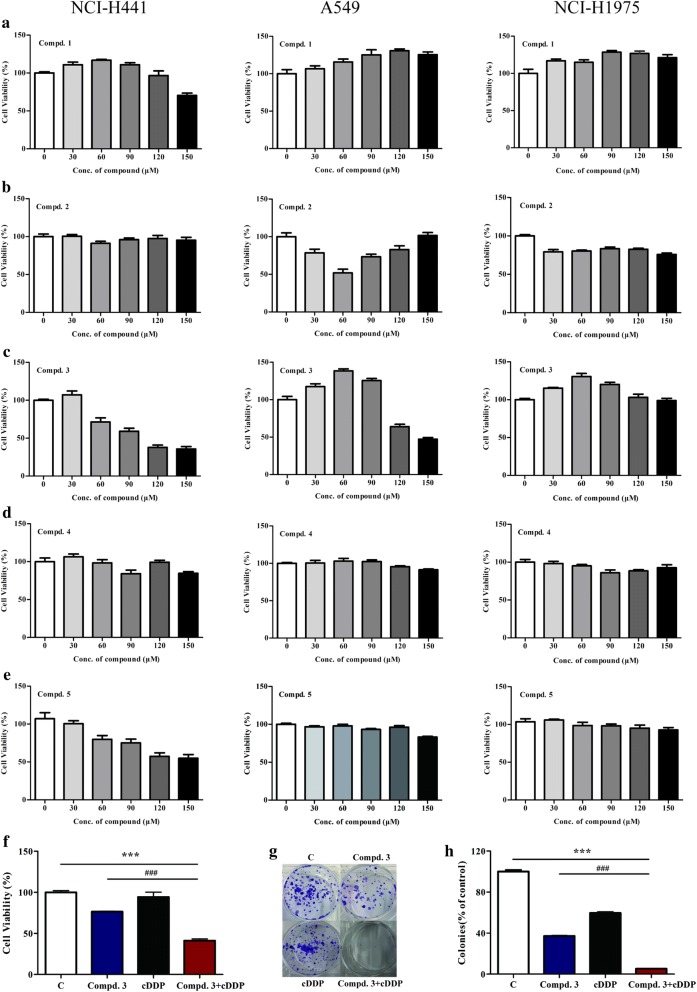
Fig. 2.
Inhibitory effects of the EGCG derivatives on NSCLC cells. a–e The inhibitory effects of compounds 1–5 on NCI-H441 (left panel), A549 (middle panel), and H1975 (right panel) cells, as evaluated by the MTT assay. f NCI-H441 cells were treated with compound 3 (100 μM) and cDDP (12 μM) in combination or individually, prior to the MTT assay. g, h Clonogenic assay of NCI-H441 cells treated with compound 3 (100 μM), cDDP (12 μM), or both. Data represent the average of three independent experiments (mean ± SD, p < 0.001). ***p < 0.001, cDDP + compound 3 vs cDDP; ###p < 0.001, cDDP + compound 3 vs compound 3

