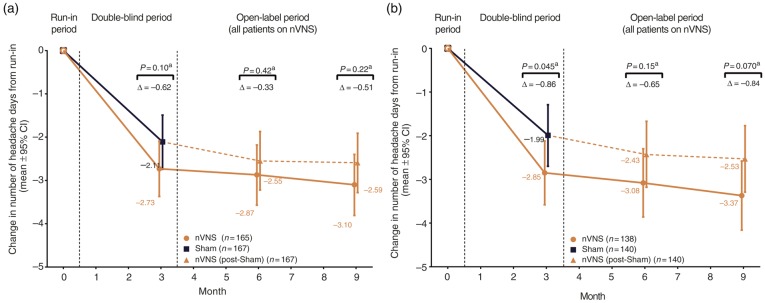
Figure 5.
Changes in number of headache days over time for (a) the ITT population and (b) the mITT population.
aThe nVNS and sham groups were compared using ANCOVA models; p-values were derived from linear regression adjusted for treatment group, centre, presence/absence of aura (based on diagnosis provided in subject medical history at enrolment), and number of migraine days in the run-in period.
ANCOVA: analysis of covariance; CI: confidence interval; ITT: intent-to-treat; nVNS: non-invasive vagus nerve stimulation.

