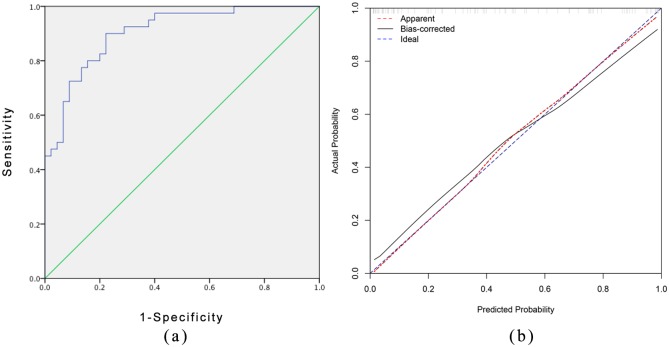
Figure 3.
Measures of accuracy of the nomogram for the prediction in primary cohort.
(a) Discrimination based on ROC with C-index = 0.906 (95% confidence interval 0.844–0.967) in primary cohort. (b) The calibration curves for the nomogram. The x axis represents the nomogram-predicted probability and y axis represents the actual probability of response of EEN therapy. Perfect prediction would correspond to the 45 blue dashed line. The red dotted line represents the primary cohort (n = 85), and the black solid line is bias corrected by bootstrapping (B = 1000 repetitions), indicating observed nomogram performance.
EEN, exclusive enteral nutrition; ROC, receiver operating characteristic curve.

