Figure 4.
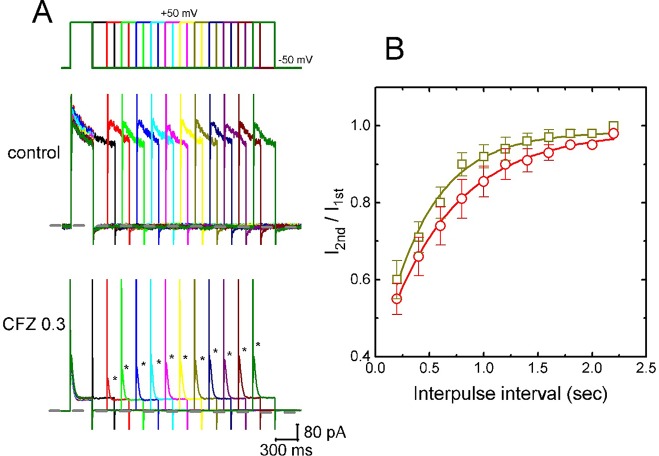
Time course of the recovery of I K(DR) in the presence of 0.3 and 1 µM CFZ. In these experiments, GH3 cells, bathed in Ca2+-free Tyrode’s solution, were depolarized from −50 to +50 mV with a duration of 300 ms and different interpulse durations were applied. (A) Representative I K(DR) traces in the absence (upper) and presence (lower) of 0.3 µM CFZ elicited by a two-pulse protocol with different interpulse durations (indicated in the upper part). Dashed line indicates the zero current level. (B) Time courses of recovery from I K(DR) inactivation caused by 0.3 µM CFZ (open squares) and 1 µM CFZ (open circles), respectively. Smooth curves in the presence of different CFZ concentrations were fitted by single exponential. Each point represents the mean ± SEM (n = 8). Asterisks indicate the peak I K(DR) elicited by different interpulse intervals.

