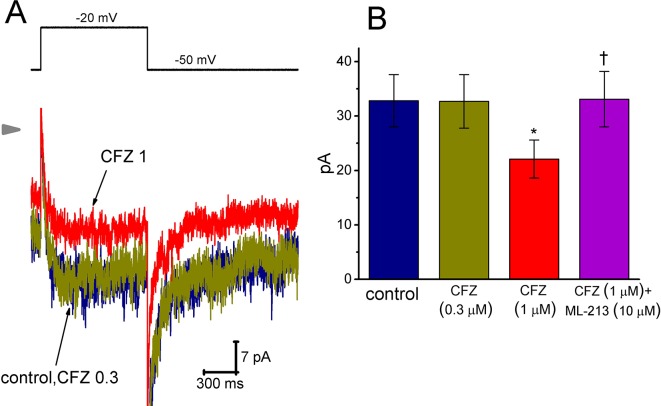
Figure 5.
Effect of CFZ on I K(M) in GH3 cells. To record I K(M), we bathed cells in high-K+, Ca2+-free solution and filled the recording pipette by using K+-containing solution. (A) Representative I K(M) traces in response to membrane depolarization (indicated in the upper part). CFZ 0.3:0.3 µM CFZ; CFZ 1:1 µM CFZ. Arrowhead shows the zero current level. (B) Bar graph showing the effects of CFZ and CFZ plus ML-213 on I K(M) amplitude taken from GH3 cells (mean ± SEM; n = 8–9 for each bar). Current amplitude was measured at the end of depolarizing pulse from −50 to −20 mV. *Significantly different from control (P < 0.05) and †significantly different from 1 µM CFZ alone group (P < 0.05).

