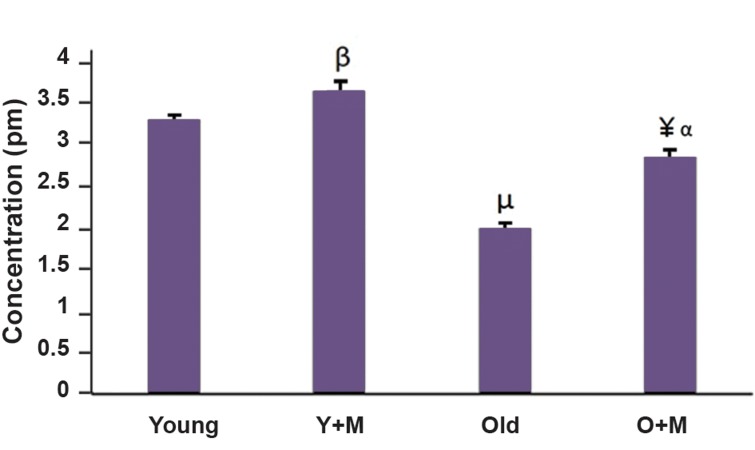
Fig.3.
The levels of the ATP contents of in vitro matured MII oocytes in all experimental groups, namely aged MII oocyte, young MII oocyte, aged MII oocyte+10 µM melatonin, and young MII oocyte+10 µM melatonin. Each group consisted of 35-50 MII oocytes. The obtained data were represented as mean ± SD. ¥; P<0.001 vs. aged group, ß; P<0.05 vs. young group, a; P<0.01 vs. young group, µ; P. 0.001 vs. young group, Y+M; Young+melatonin, and O+M; Aged+melatonin.

