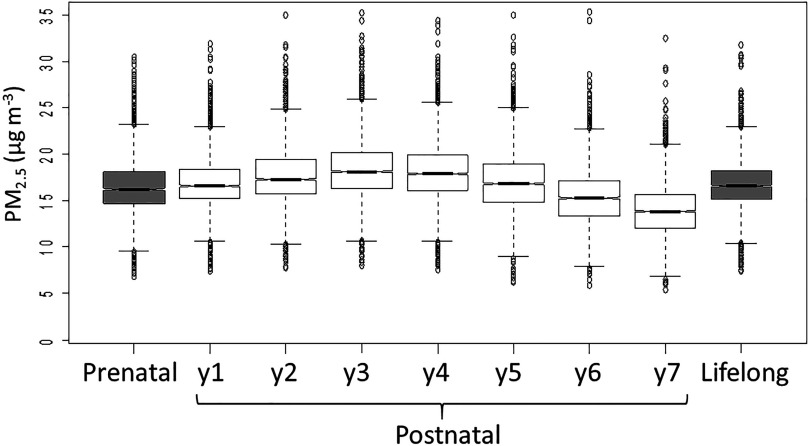
Figure 1.
Concentrations at different time windows that the participants () are exposed to during prenatal time and childhood. The concentrations were estimated at home address for each year from the temporally adjusted LUR model for Barcelona. Lower and upper bound of the boxes represent 25th and 75th percentile, respectively; central line corresponds to the median; bars outside the box represent the ; and circles are outliers. The notch displays the confidence interval around the median. Note: .

