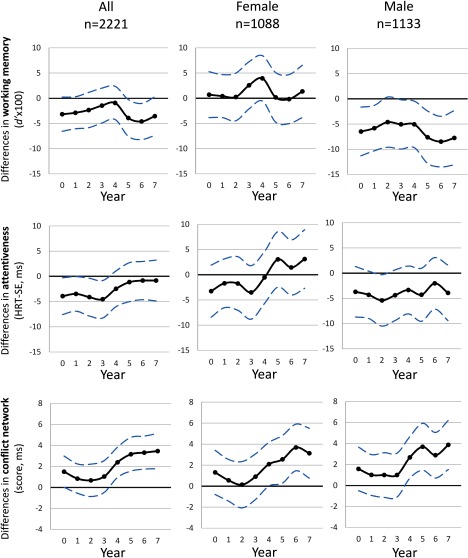
Figure 2.
Association between yearly levels estimated at home address for the pregnancy period (year 0) and the first 7 years of life and different cognitive outcomes at school age (7–10 y old): working memory, attentiveness, and conflict network from the independent linear mixed effect models. Legend: Lower and higher HRT-SE and conflict scores indicate impairment. Models were adjusted for age, sex, maternal education, and residential neighborhood socioeconomic status; school and individual as nested random effects. Solid lines show the difference in the outcomes for an IQR increase in [Interquartile range (IQR) exposure contrasts are reported in Table S4]. Dashed lines indicate 95% CIs. Note: .

