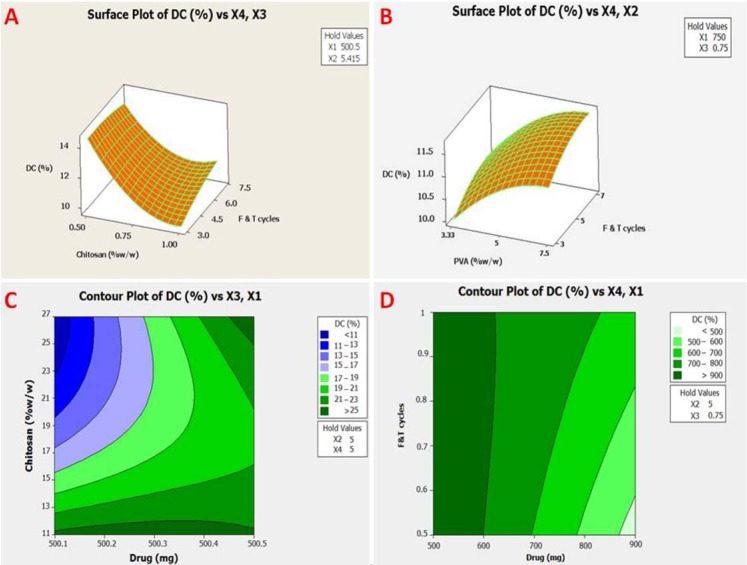
Fig. 4.
Response contour plot showing the effect of (A and B) formulation variables (X2, polyvinyl alcohol; X3, chitosan; and X4, F-T cycles) on drug content and response surface plot showing the effect of (C and D) formulation variables (X1, drug; X3, chitosan; and X4, F-T cycles) on drug content. PVA, polyvinyl alcohol; F-T, freeze-thaw; DC, drug content.

