
Fig. 2.
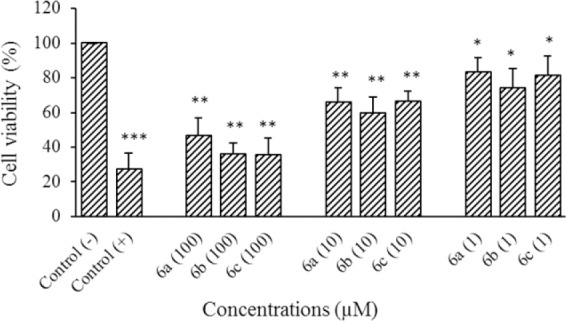
Cytotoxic effect of compounds 6a-6c on HeLa cells following exposure to different concentrations (1, 10, and 100 μM). Data are presented as mean ± SD, (SD for negative control is 0.06), n = 3.* Shows significant differences (*P < 0.05 and **P < 0.01) in comparison with negative control group; doxorubicin used as positive control.