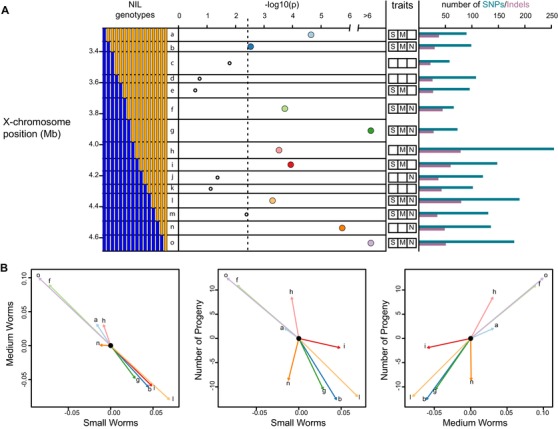
Figure 4.

NILs reveal antagonistic QTL. (A) The genotypes of the 16 NILs, at left, define 15 intervals (a‐o). By comparing strains that differ only in a single interval, we tested for the effect of the interval on demography, with the results plotted as −log10 of the P‐value. The dashed line indicates the Bonferroni‐adjusted significance threshold, P = 0.05/15. The trait column indicates which intervals have nominally significant (P < 0.05) univariate effects on each of the three traits (small, medium, and number). The bar plot at right shows the number of SNPs and indels in each interval. Each significant point is colored to facilitate comparison with panel B. (B) Estimated effects of the CB4856 genotype for each significant NIL interval.
