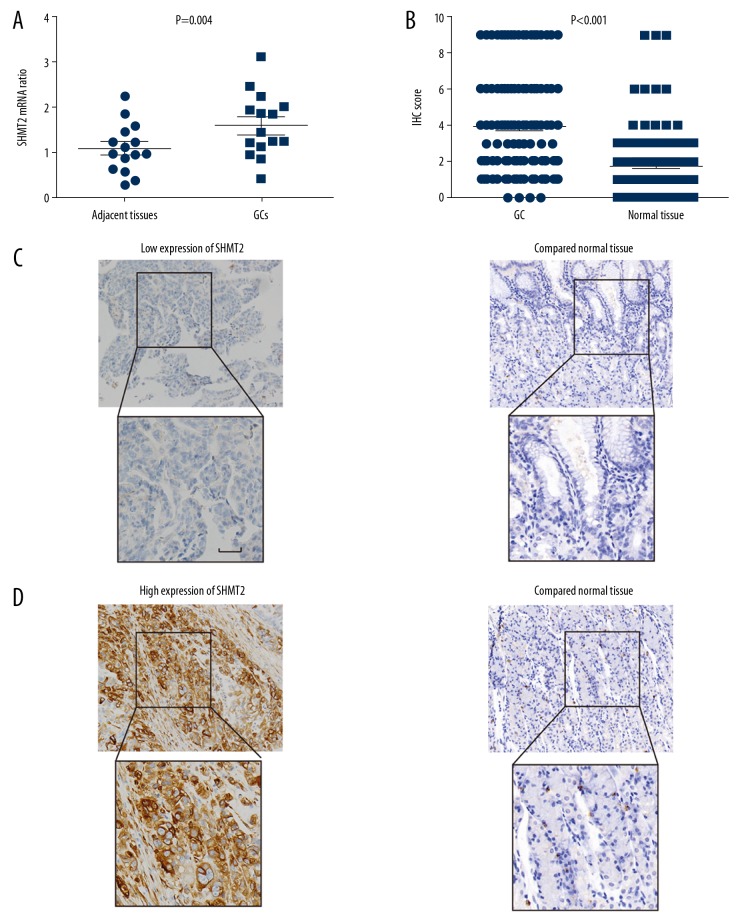
Figure 1.
Expression of SHMT2 in gastric cancer tissues and normal gastric tissues. (A) The mRNA level of SHMT2 in GCs and paired normal gastric tissues was evaluated with qRT-PCR. The P value was evaluated with the paired t test. (B) The IHC scores of GC tissues were higher than the scores of adjacent normal tissues. The P value was evaluated with the paired t test. (C, D) Representative images of low (C) and high (D) immunohistochemical staining of SHMT2 in GC tissues and paired normal tissues. Scale bar: 50 um.

