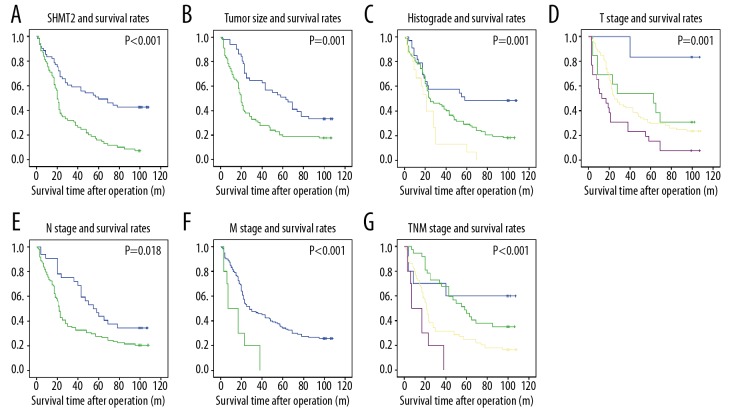
Figure 2.
The correlation between survival rates and SHMT2 expression, tumor size, histopathological grade, T stage, lymphatic invasion, distant metastasis, and TNM stage. The overall survival rates were stratified into groups according to the SHMT2 expression (A), tumor size (B), histological grade (C), tumor filtration (D), lymphatic invasion (E), metastasis (F) and TNM stage (G).

