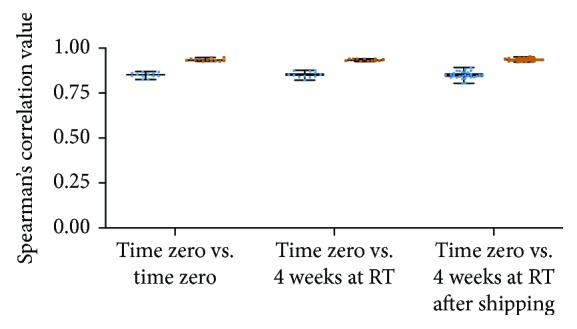
Figure 2.

Spearman's correlation of taxonomic data (blue) and functional data (orange) between and within storage conditions. Median correlation of taxonomic data: T0 vs. T0 = 0.8493; T0 vs. T4weeksRT = 0.8503; T0 vs. T4weeksSHIP = 0.8493. Median correlation values of functional data: T0 vs. T0 = 0.932; T0 vs. T4weeksRT = 0.9341; T0 vs. T4weeksSHIP = 0.9349.
