Figure 2.

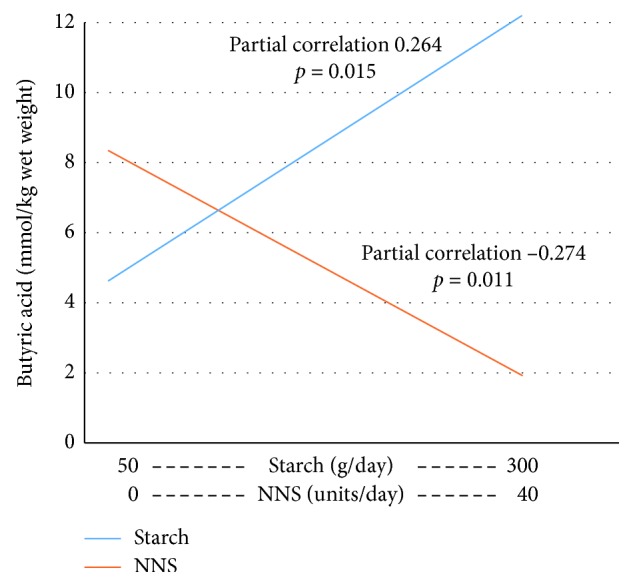
Regression lines for the associations between starch and NNSs (on the x-axis) and butyric acid (on the y-axis) calculated at the mean of the covariates age, gender, use of metformin, and/or NNSs/starch.

Regression lines for the associations between starch and NNSs (on the x-axis) and butyric acid (on the y-axis) calculated at the mean of the covariates age, gender, use of metformin, and/or NNSs/starch.