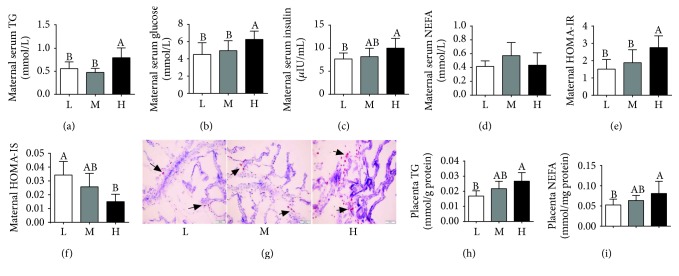
Figure 2.
Metabolic characterization of gilts. Maternal serum TG (a), glucose (b), insulin (c), and NEFA (d). n = 8. (e) HOMA‐IR = [fasting glucose (mmol/L) × fasting insulin (μU/mL)]/22.5. (f) HOMA‐IS = 1/[(fasting insulin, μIU/L) × (fasting glucose, mmol/L)]. (g) Placental oil red O staining (×200 magnification, bar = 100 μm). (h, i) Placental TG and NEFA levels, respectively. Values are mean ± SD (n = 11). Different letters indicate significant differences at P < 0.05.

