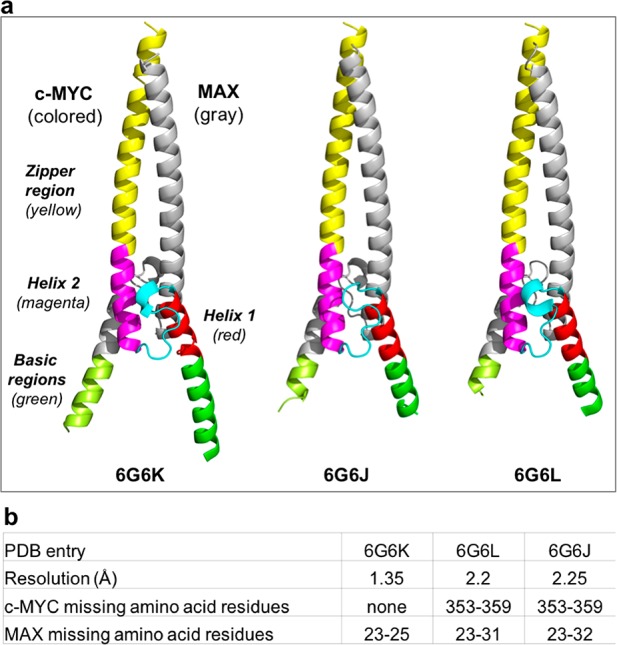
Figure 6.

Side-by-side comparison of the cartoon representations of the three crystal structures of the c-MYC:MAX bHLHZip apo complex. (a) For each of the crystal structures, for MYC, the zipper region is colored yellow, helix 2 magenta, the loop cyan, and helix 1 red, and for MAX, the corresponding regions are all colored gray. The basic region in MYC is colored green, and that in MAX light green. (b) Table showing the missing residues in each of the free crystal forms.
